


Ocean Acidification Data Visualization
My Role:
UI designer, Data researcher, Graphic designer, Interactive designer.
6/2022 - 9/2023; Team of 2.
Jump to:
Ocean acidification is a significant environmental issue that affects the health of marine life and the oceans. It is caused by the carbon dioxide absorbed by the seawater from the atmosphere.
These models accelerated the research and application for ocean conservation and helped the public learn the pH rates of different regions of the sea efficiently. It is a great step for ocean protection and environmental education.
Introduction

3D global map
Dynamic scatterplots
Interactive graphics
This project has helped to reveal the yearly changing ocean HP rates for 4 regions of the sea: Bermuda, Hawaii, Carriacou, and the Canary Islands.
Research & Survey
What is OceanAcidification?
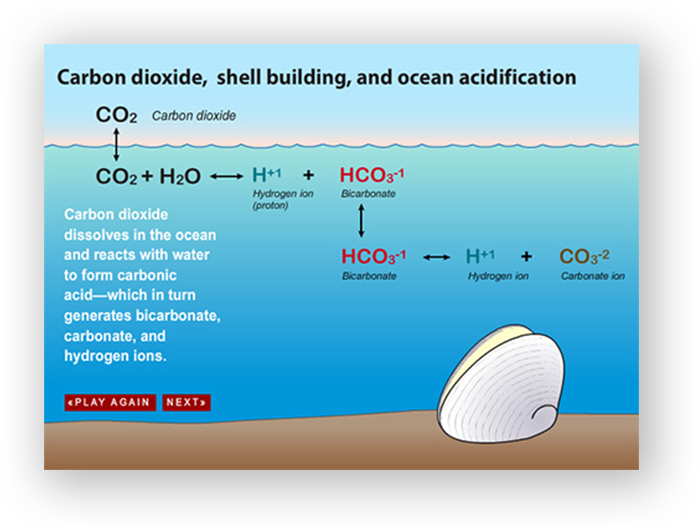
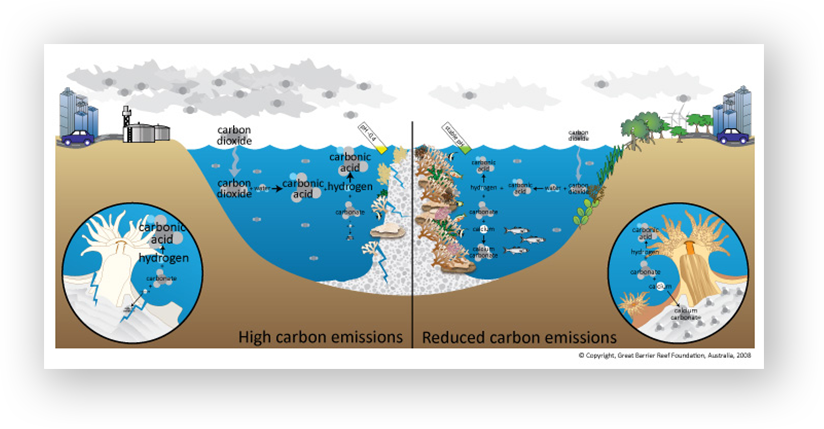
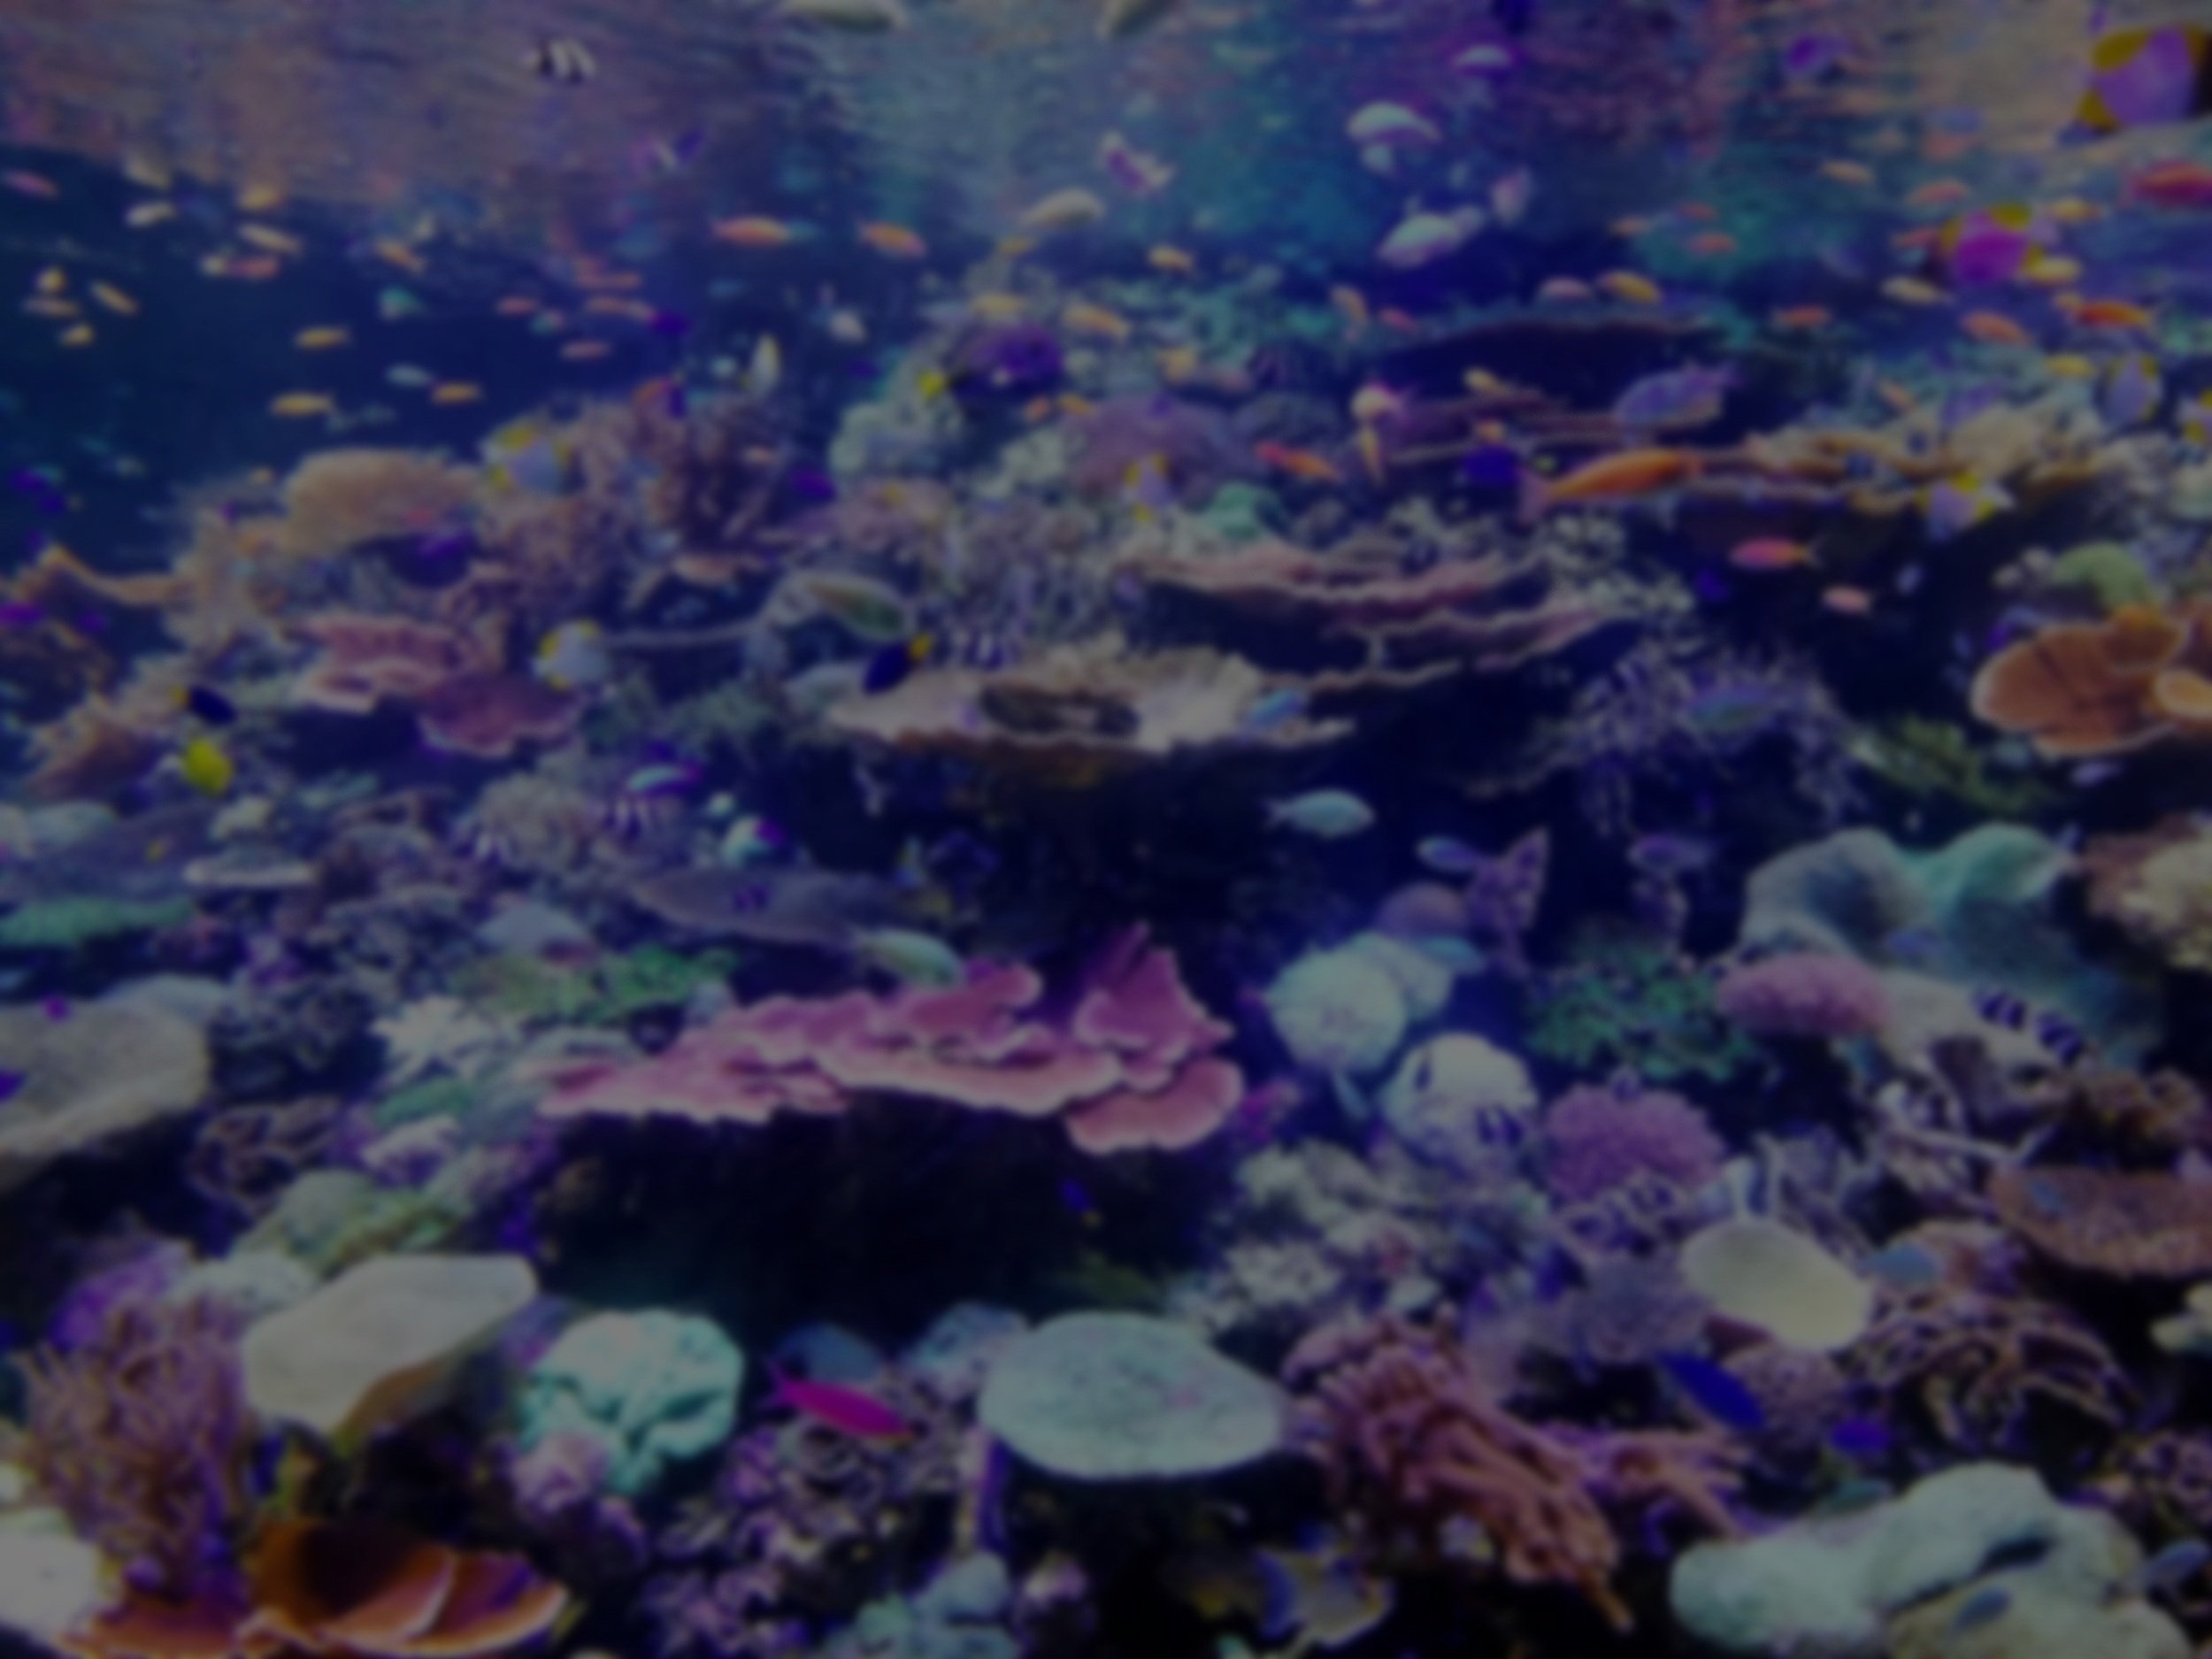
Imagine a world where the very water that gives life to our planet becomes a silent threat to its inhabitants. Ocean acidification, a consequence of increased carbon dioxide emissions, paints this grim reality. As carbon dioxide dissolves into the ocean, it triggers a chemical reaction that lowers the water's pH, rendering it more acidic. This subtle transformation ripples through marine ecosystems, spelling danger for creatures great and small.
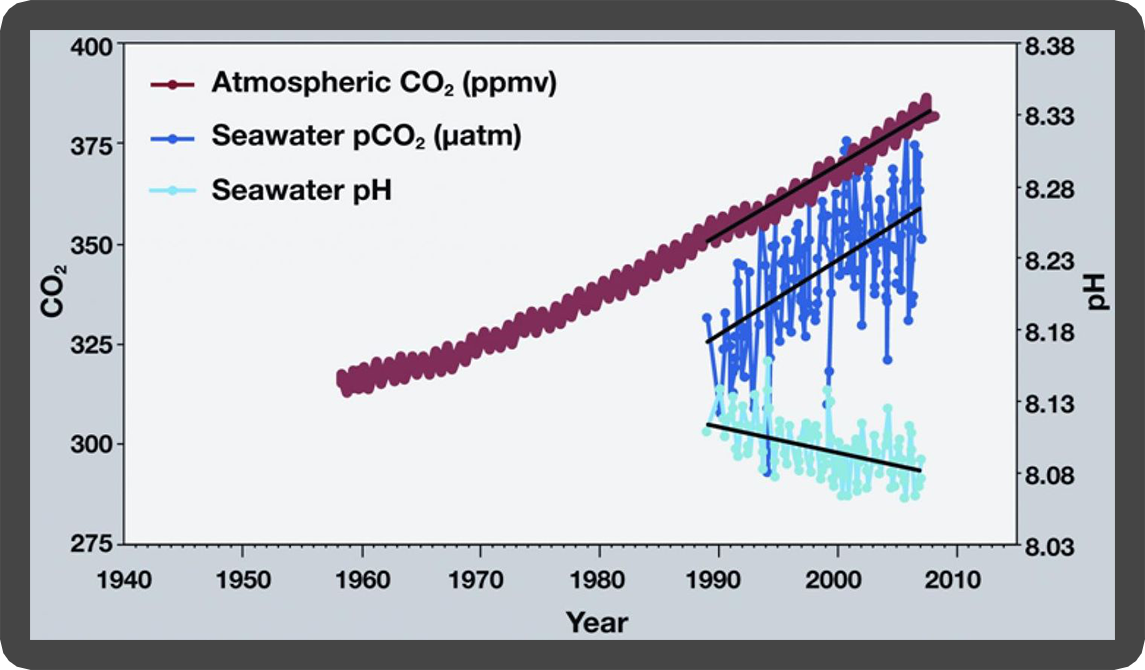
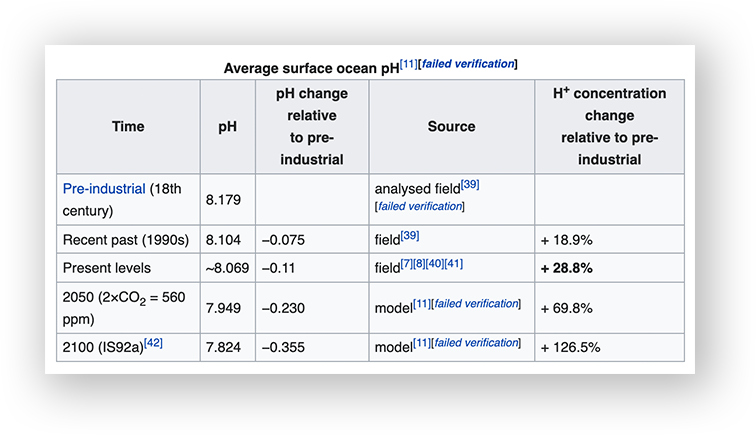
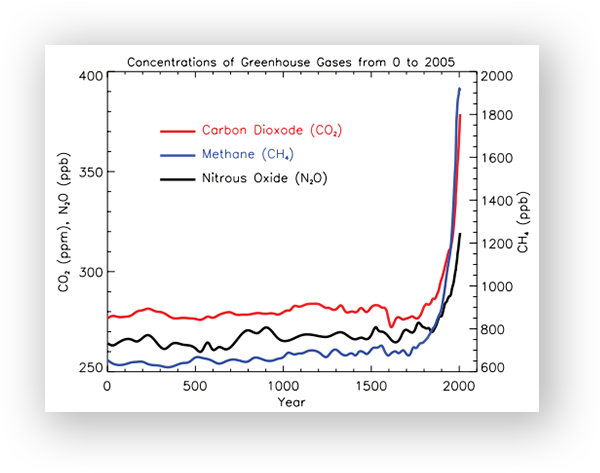
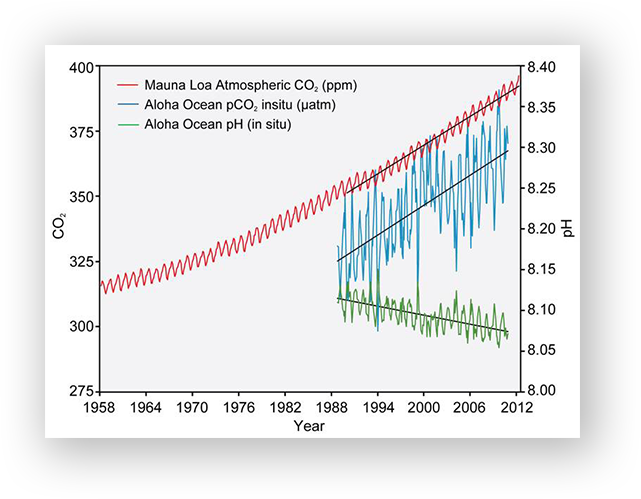
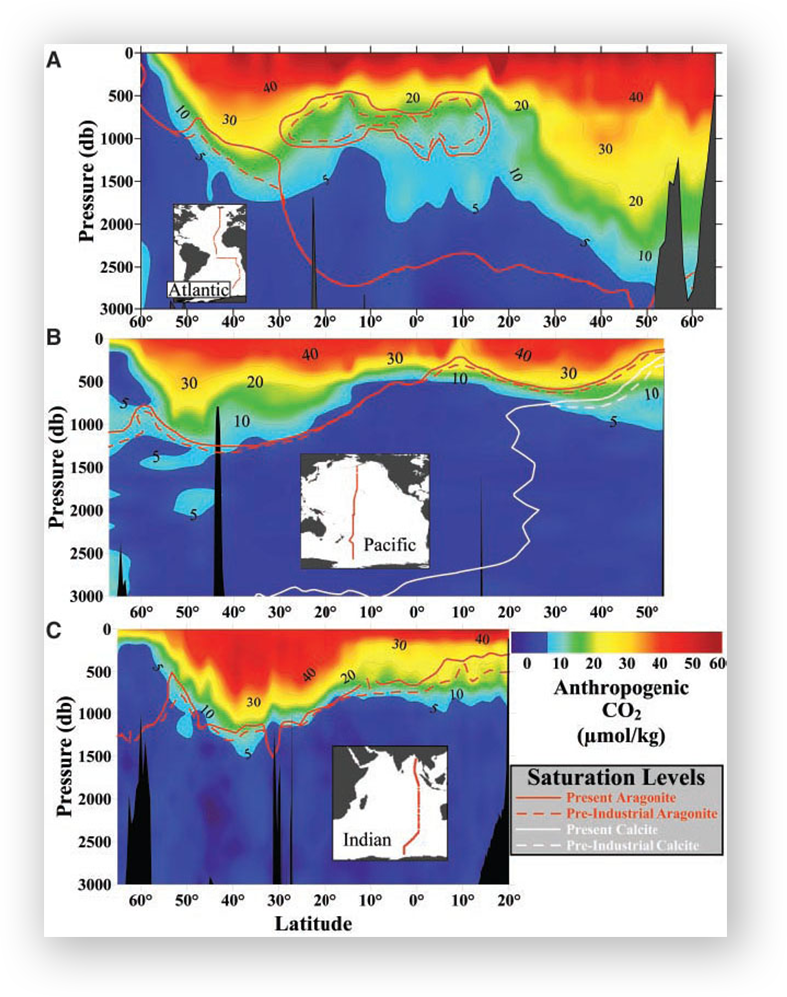
Over the past 200 years, the Industrial Revolution has led to an increase in the concentration of carbon dioxide (CO2) in the atmosphere. As seawater absorbs this additional CO2 from the air, the pH of surface ocean waters has decreased by 0.1 pH units. This rise in seawater acidity disrupts various chemical balances within the ocean, posing a significant threat to a diverse range of marine organisms and ecosystems that rely on a stable chemical environment.
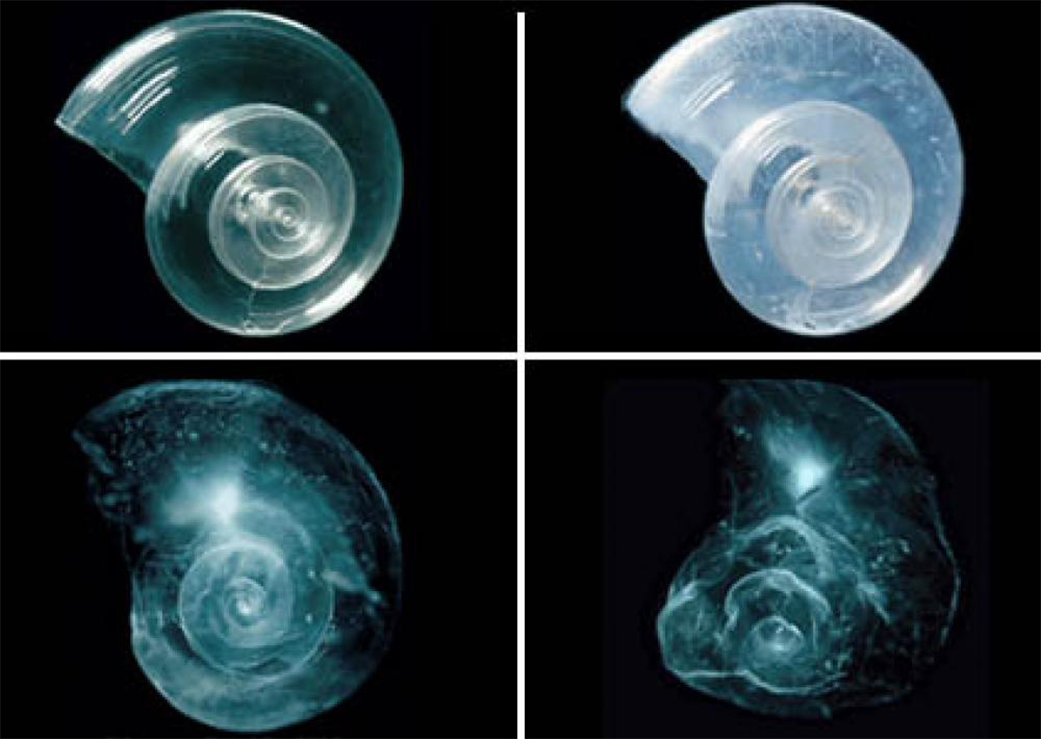
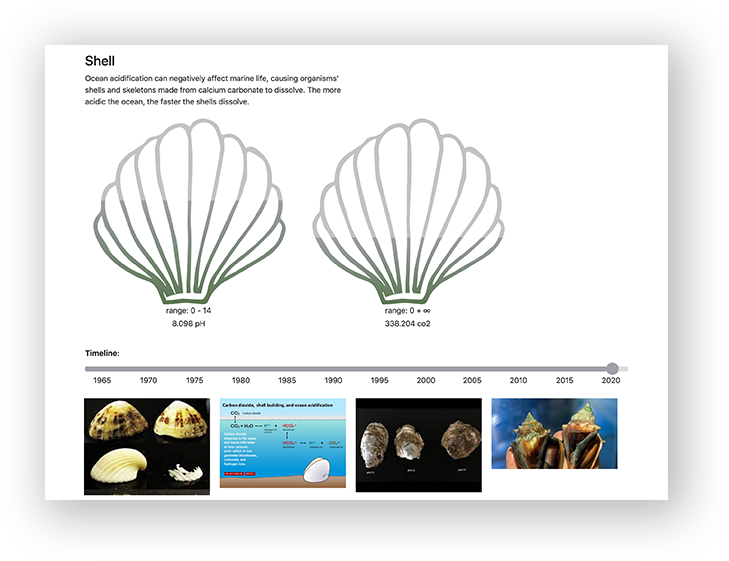
A shell placed in seawater with increased acidity slowly dissolves over 45 days. National Oceanic and Atmospheric Administration, Pacific Marine Environmental Laboratory
A pteropod shell is shown dissolving over time in seawater with a lower pH. When carbon dioxide is absorbed by the ocean from the atmosphere, the chemistry of the seawater is changed. (Image credit: NOAA)
Impact
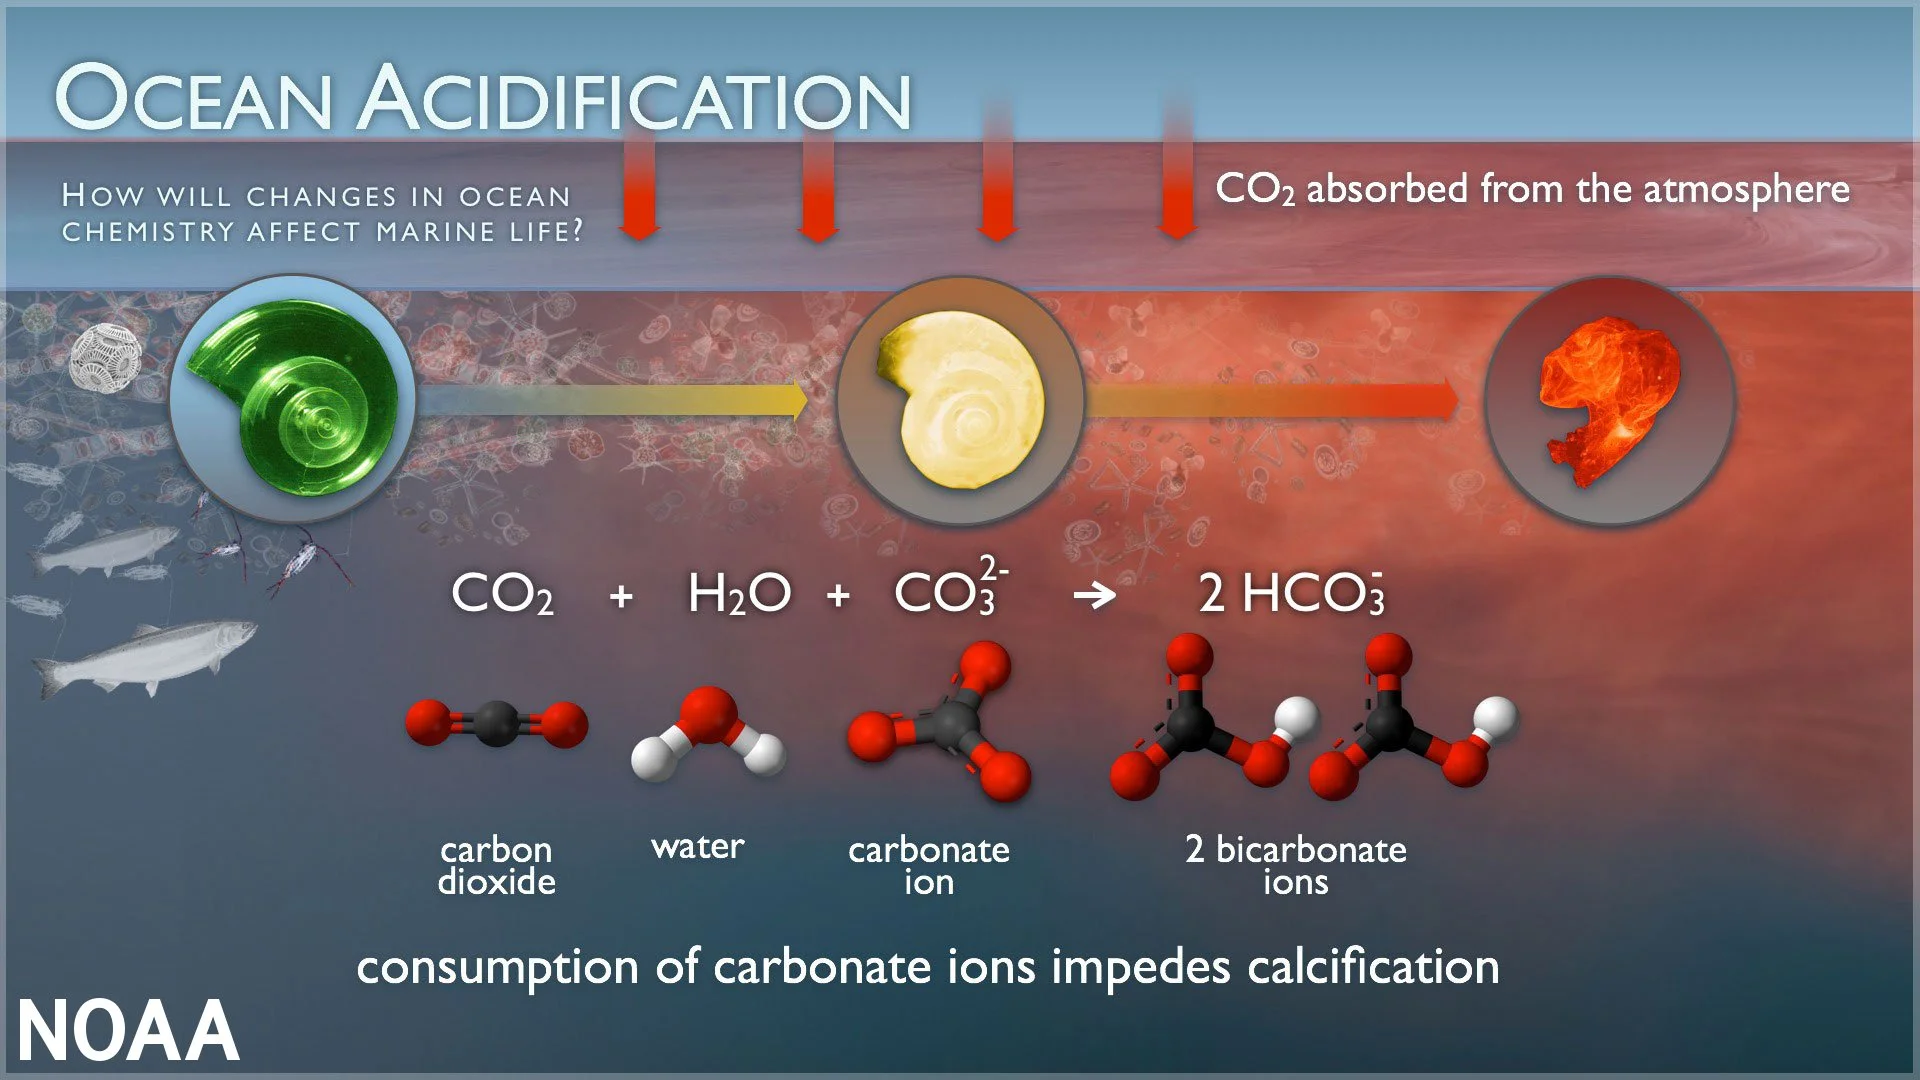
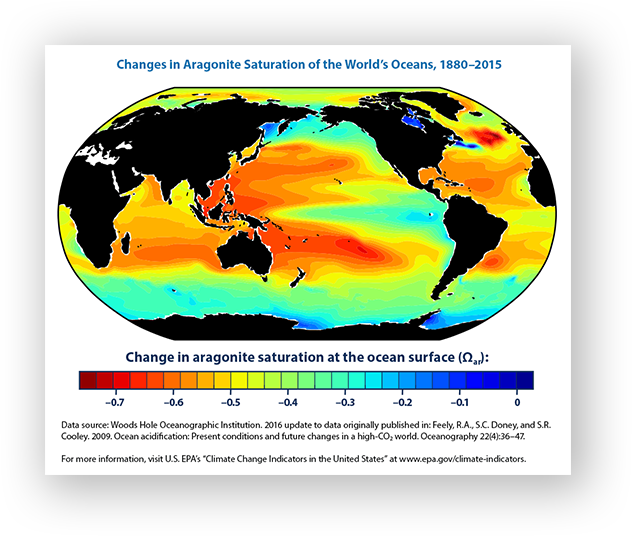
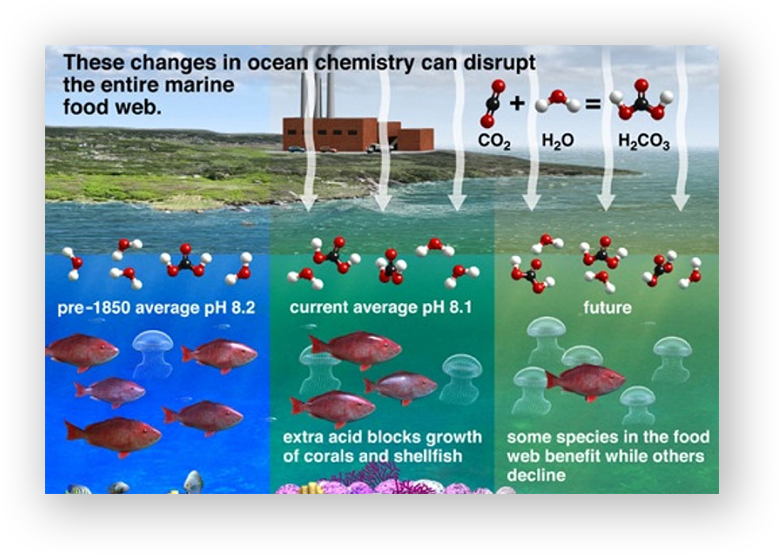
Organisms such as oysters and corals form robust shells and skeletons by utilizing calcium and carbonate from seawater. However, with the progression of ocean acidification, surplus hydrogen bonds with available carbonate ions (CO32-), diminish the supply of carbonate ions for calcifying organisms to construct and uphold their calcium carbonate structures. In more extreme cases, excessively low pH levels can even result in the dissolution of shells and skeletons.
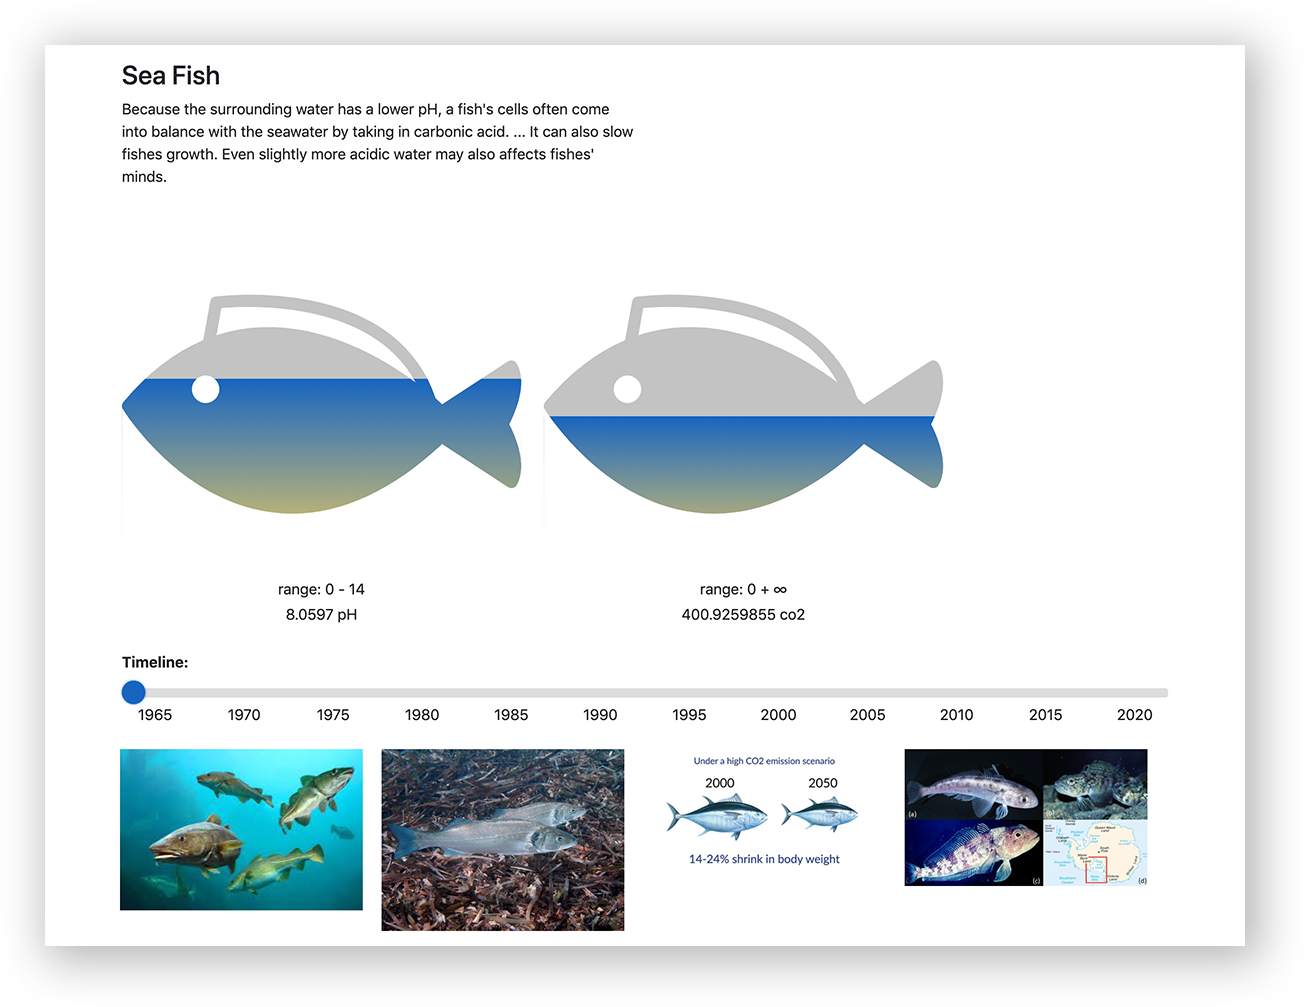
Beyond calcifying species, non-calcifying organisms also experience ramifications due to shifts in ocean chemistry. Acidic waters can impair the ability of certain fish, like clownfish, to detect predators. Research indicates that decreased pH levels also hinder the capacity of larval clownfish to locate suitable habitats. When these organisms are endangered, the entire marine food web faces potential disruption.
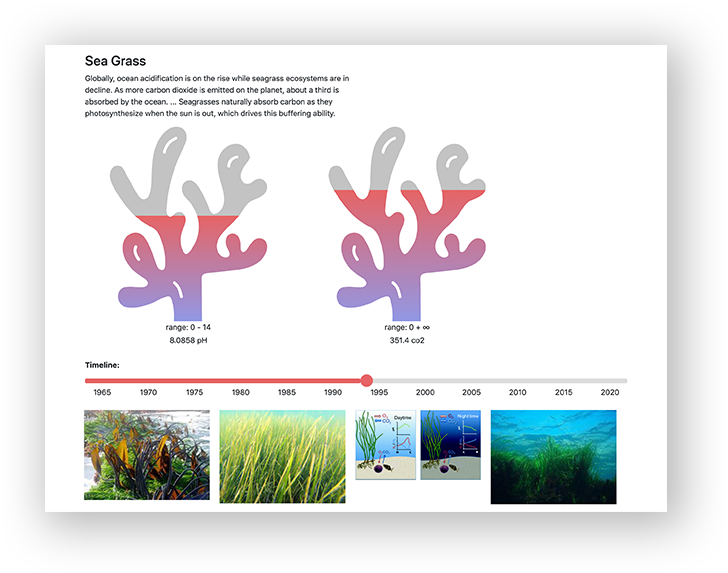
While algae and seagrasses can thrive in elevated CO2 conditions, as they require CO2 for photosynthesis similar to land plants, this shift can trigger an ecological imbalance in the marine environment, affecting various species.
Threat of Extinction
The ocean is undeniably undergoing profound transformations. Failing to take prompt and decisive action could not only impact our present way of life but could also gravely affect the lives of our descendants. Historical geological records highlight the complexity of factors leading to species extinction, often involving "acidification."
Project Inspiration
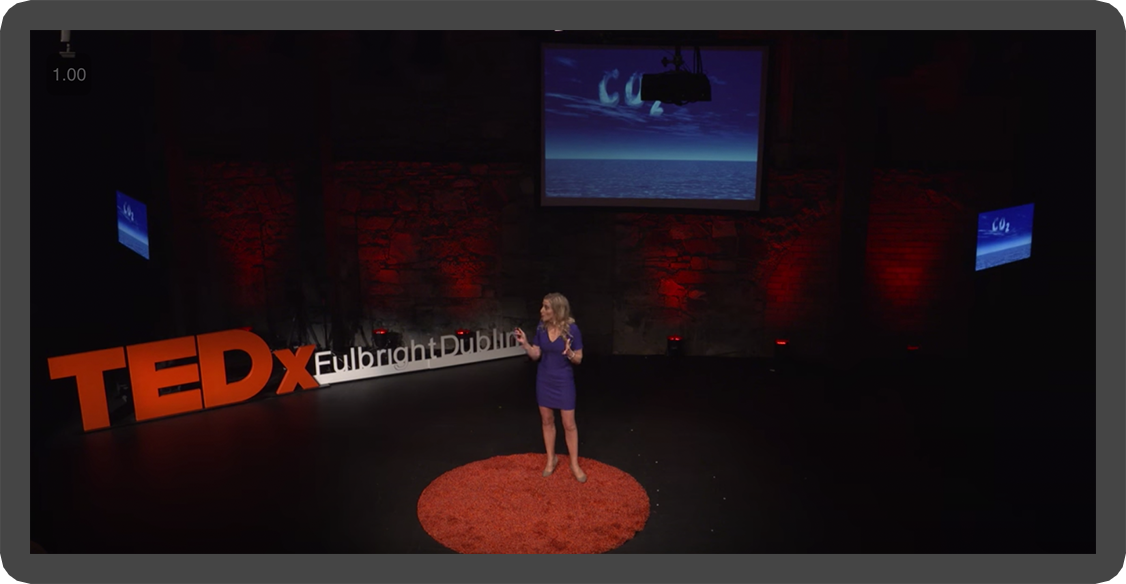
My interest in "ocean acidification" was sparked through Ted talks. These talks discussed the alarming pace of acidification and its substantial contribution to species extinction. Given my academic focus, I recognized this issue as both urgent and substantial. However, public awareness regarding the endangerment of our oceans and marine species remains inadequate. To bridge this gap, I've embraced the approach of "data visualization" to illustrate the evident connections between human activities, ocean pH, and marine species quantities.

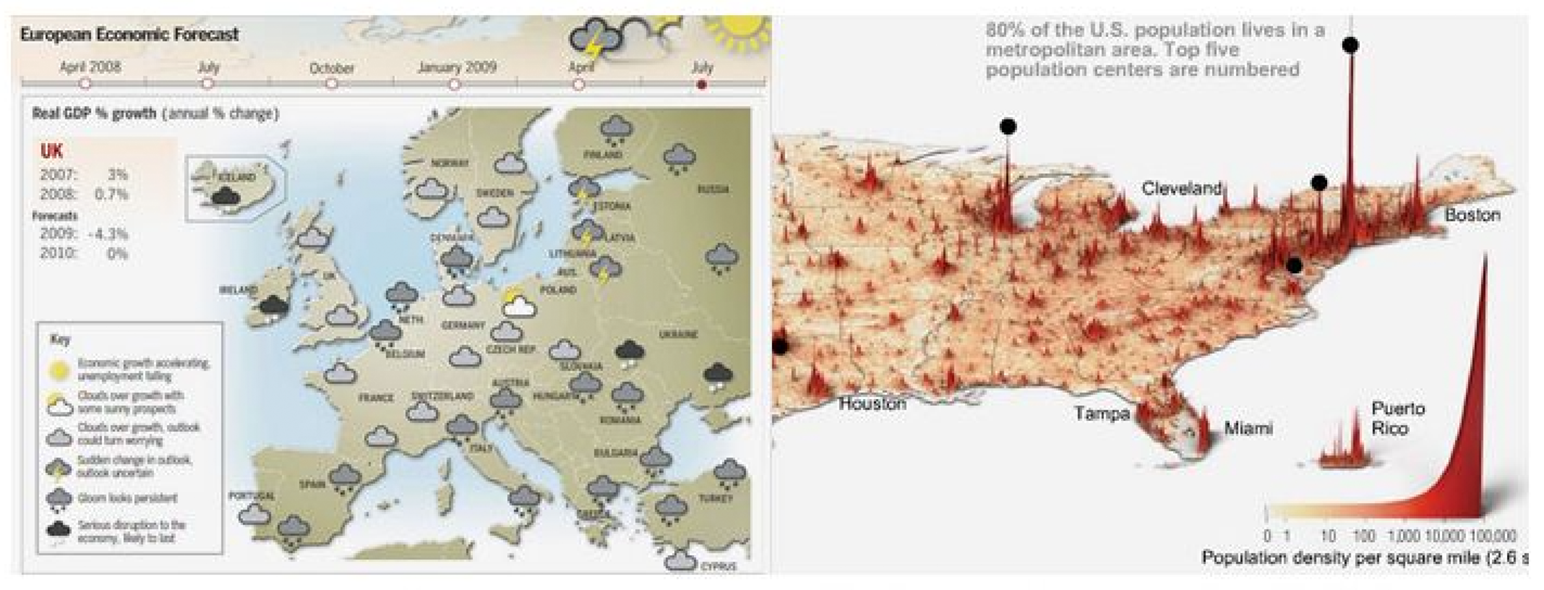
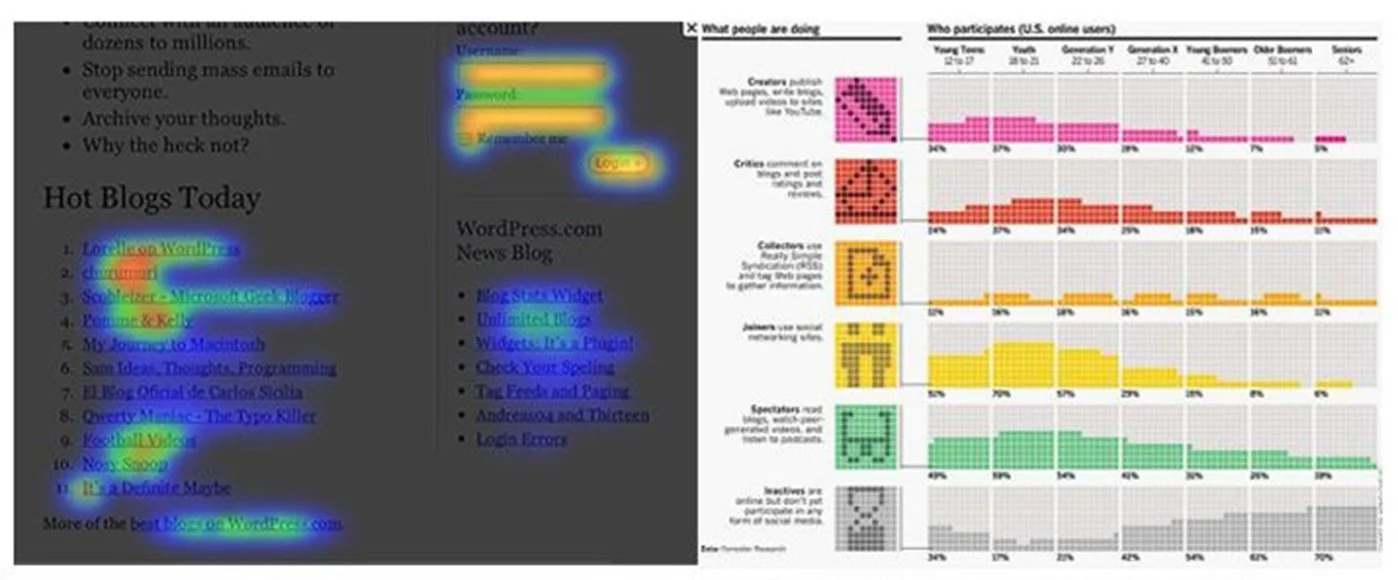
Extensive research into data visualization techniques has revealed four primary categories: map-based, icon-based, relationship-based, and abstract visualizations. Commonly employed tools and elements encompass Column Charts, Bar Graphs, Line Graphs, Dual-Axis Charts, Mekko Charts, Pie Charts, Scatter Plots, and more.


Research Mindmap

Interview
In my interviews, I formulated three key questions:
Are you attentive to environmental concerns?
Are you familiar with "Ocean Acidification," and how do you envision its impact?
What type of data visualization appeals to you, and why do you find it effective?


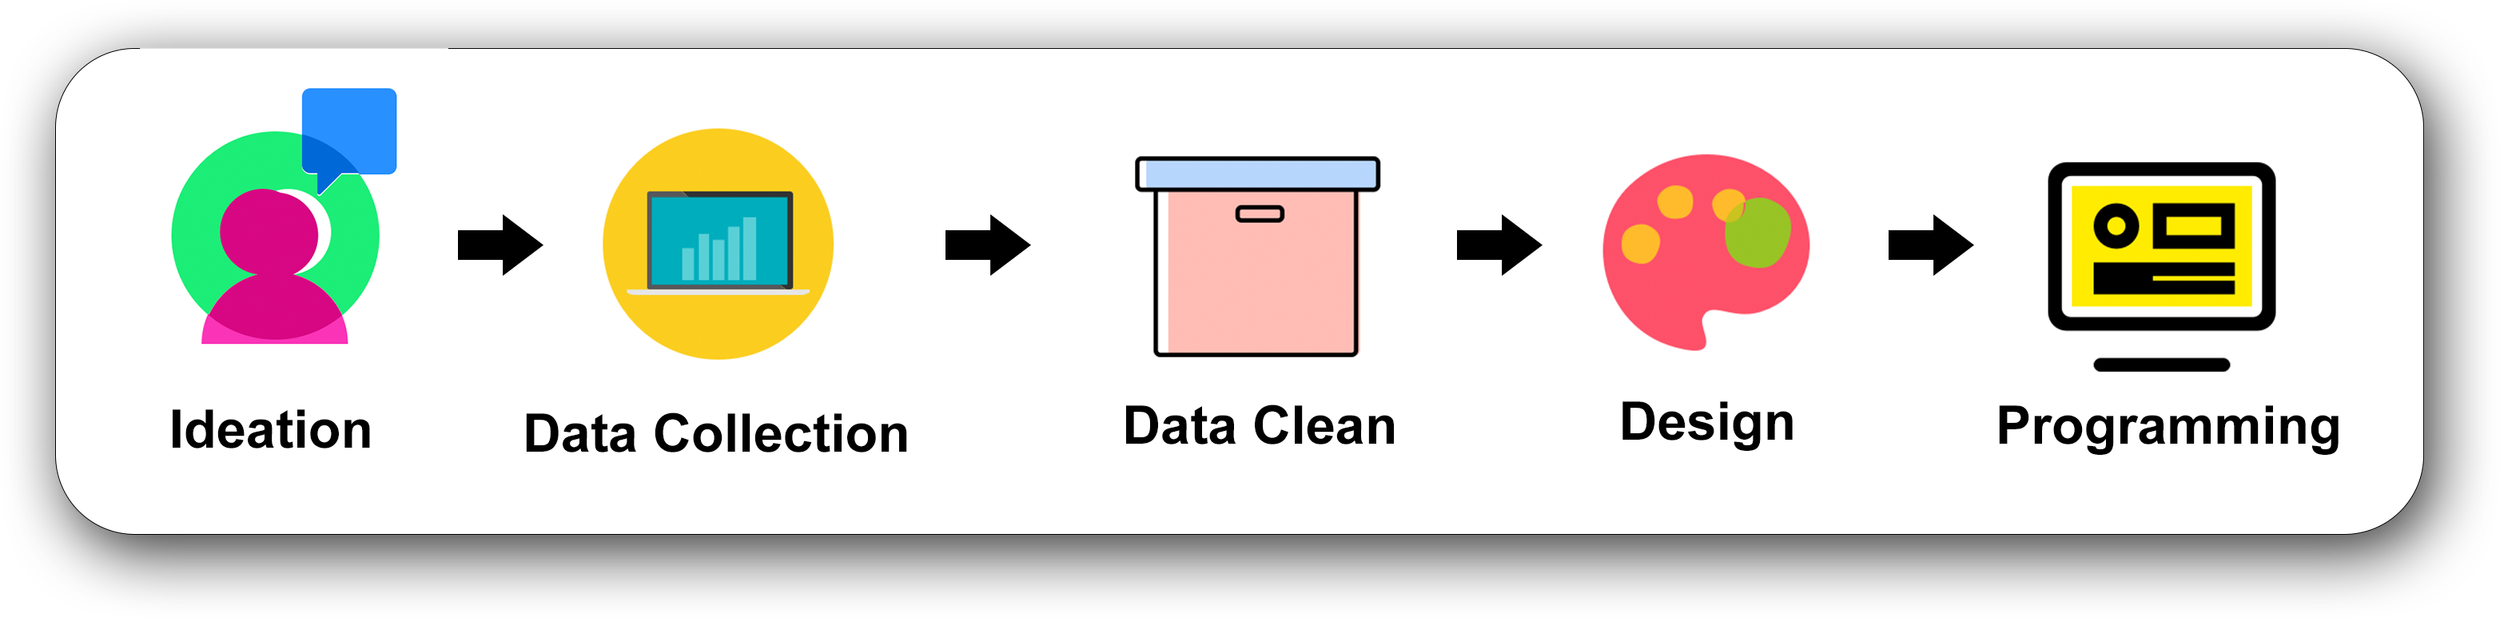
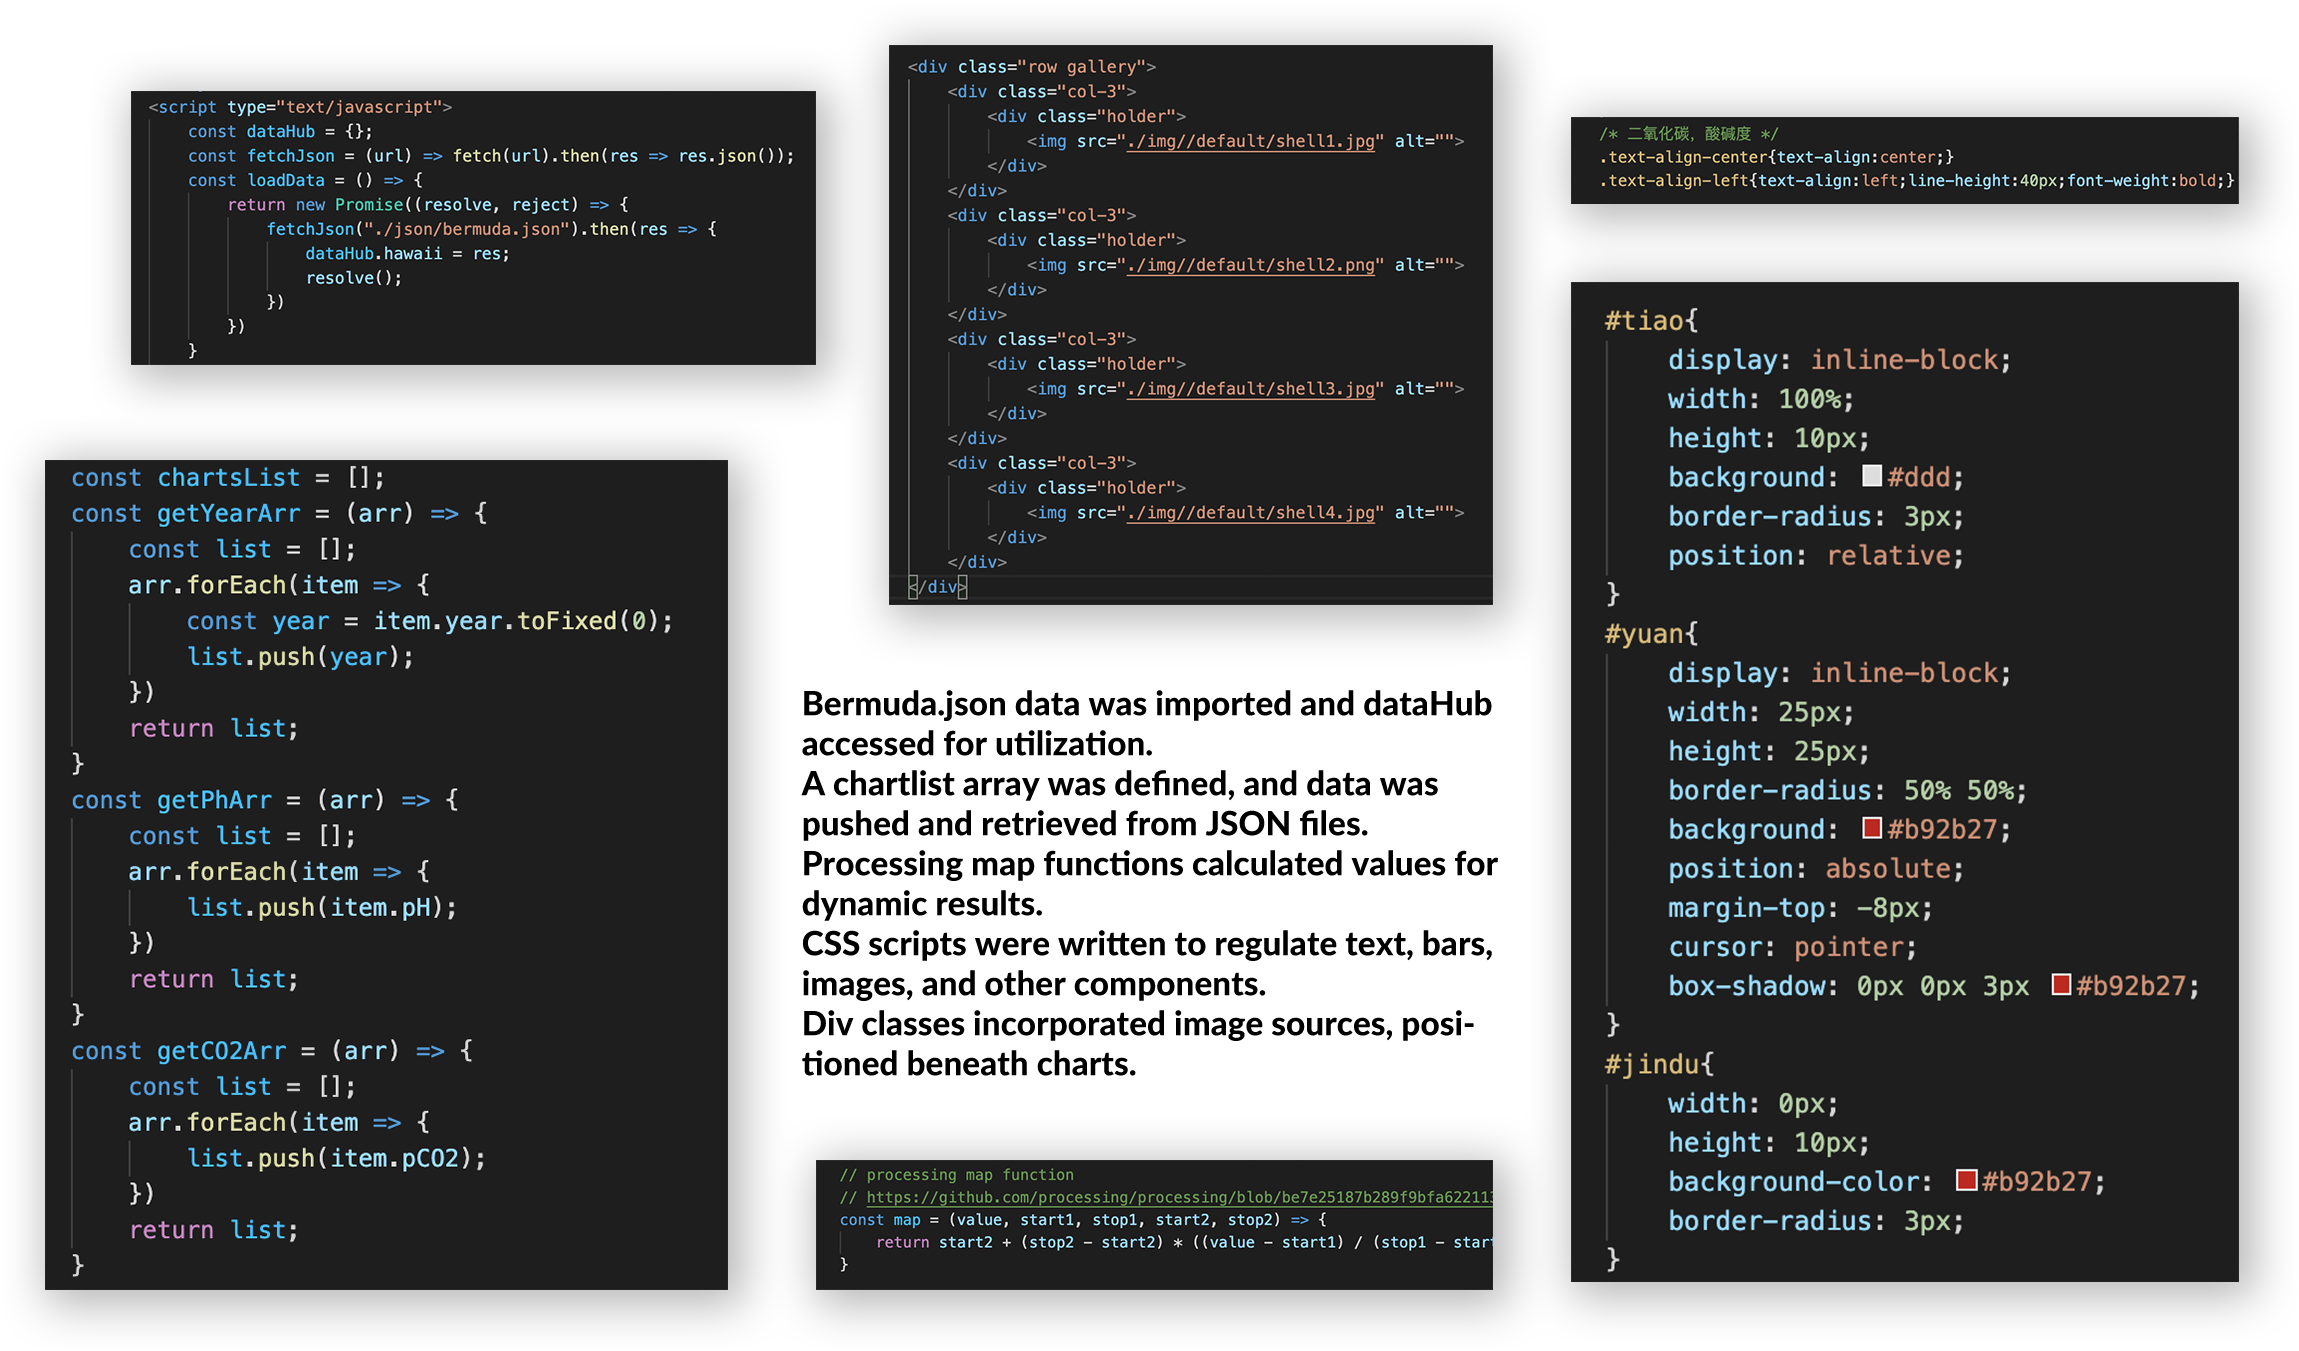
2. Data Collection & Processing


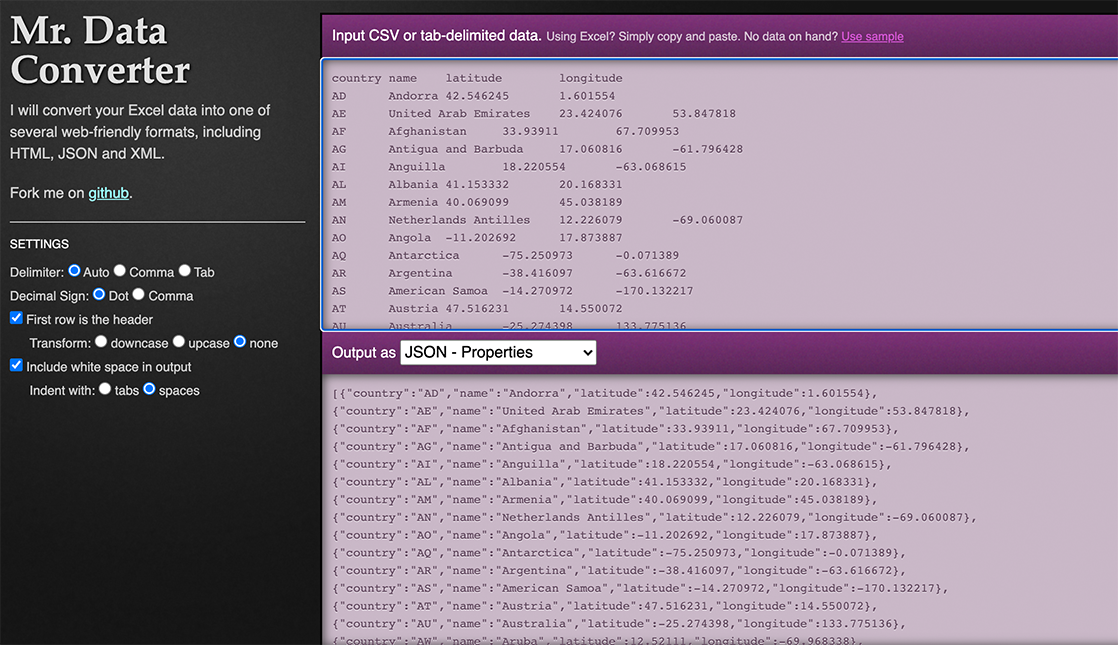
In Excel

Convert .xlsx to JSON properties


A visualized program could provide instance reference for the ocean acidification condition.
3. Programming for Visual Application
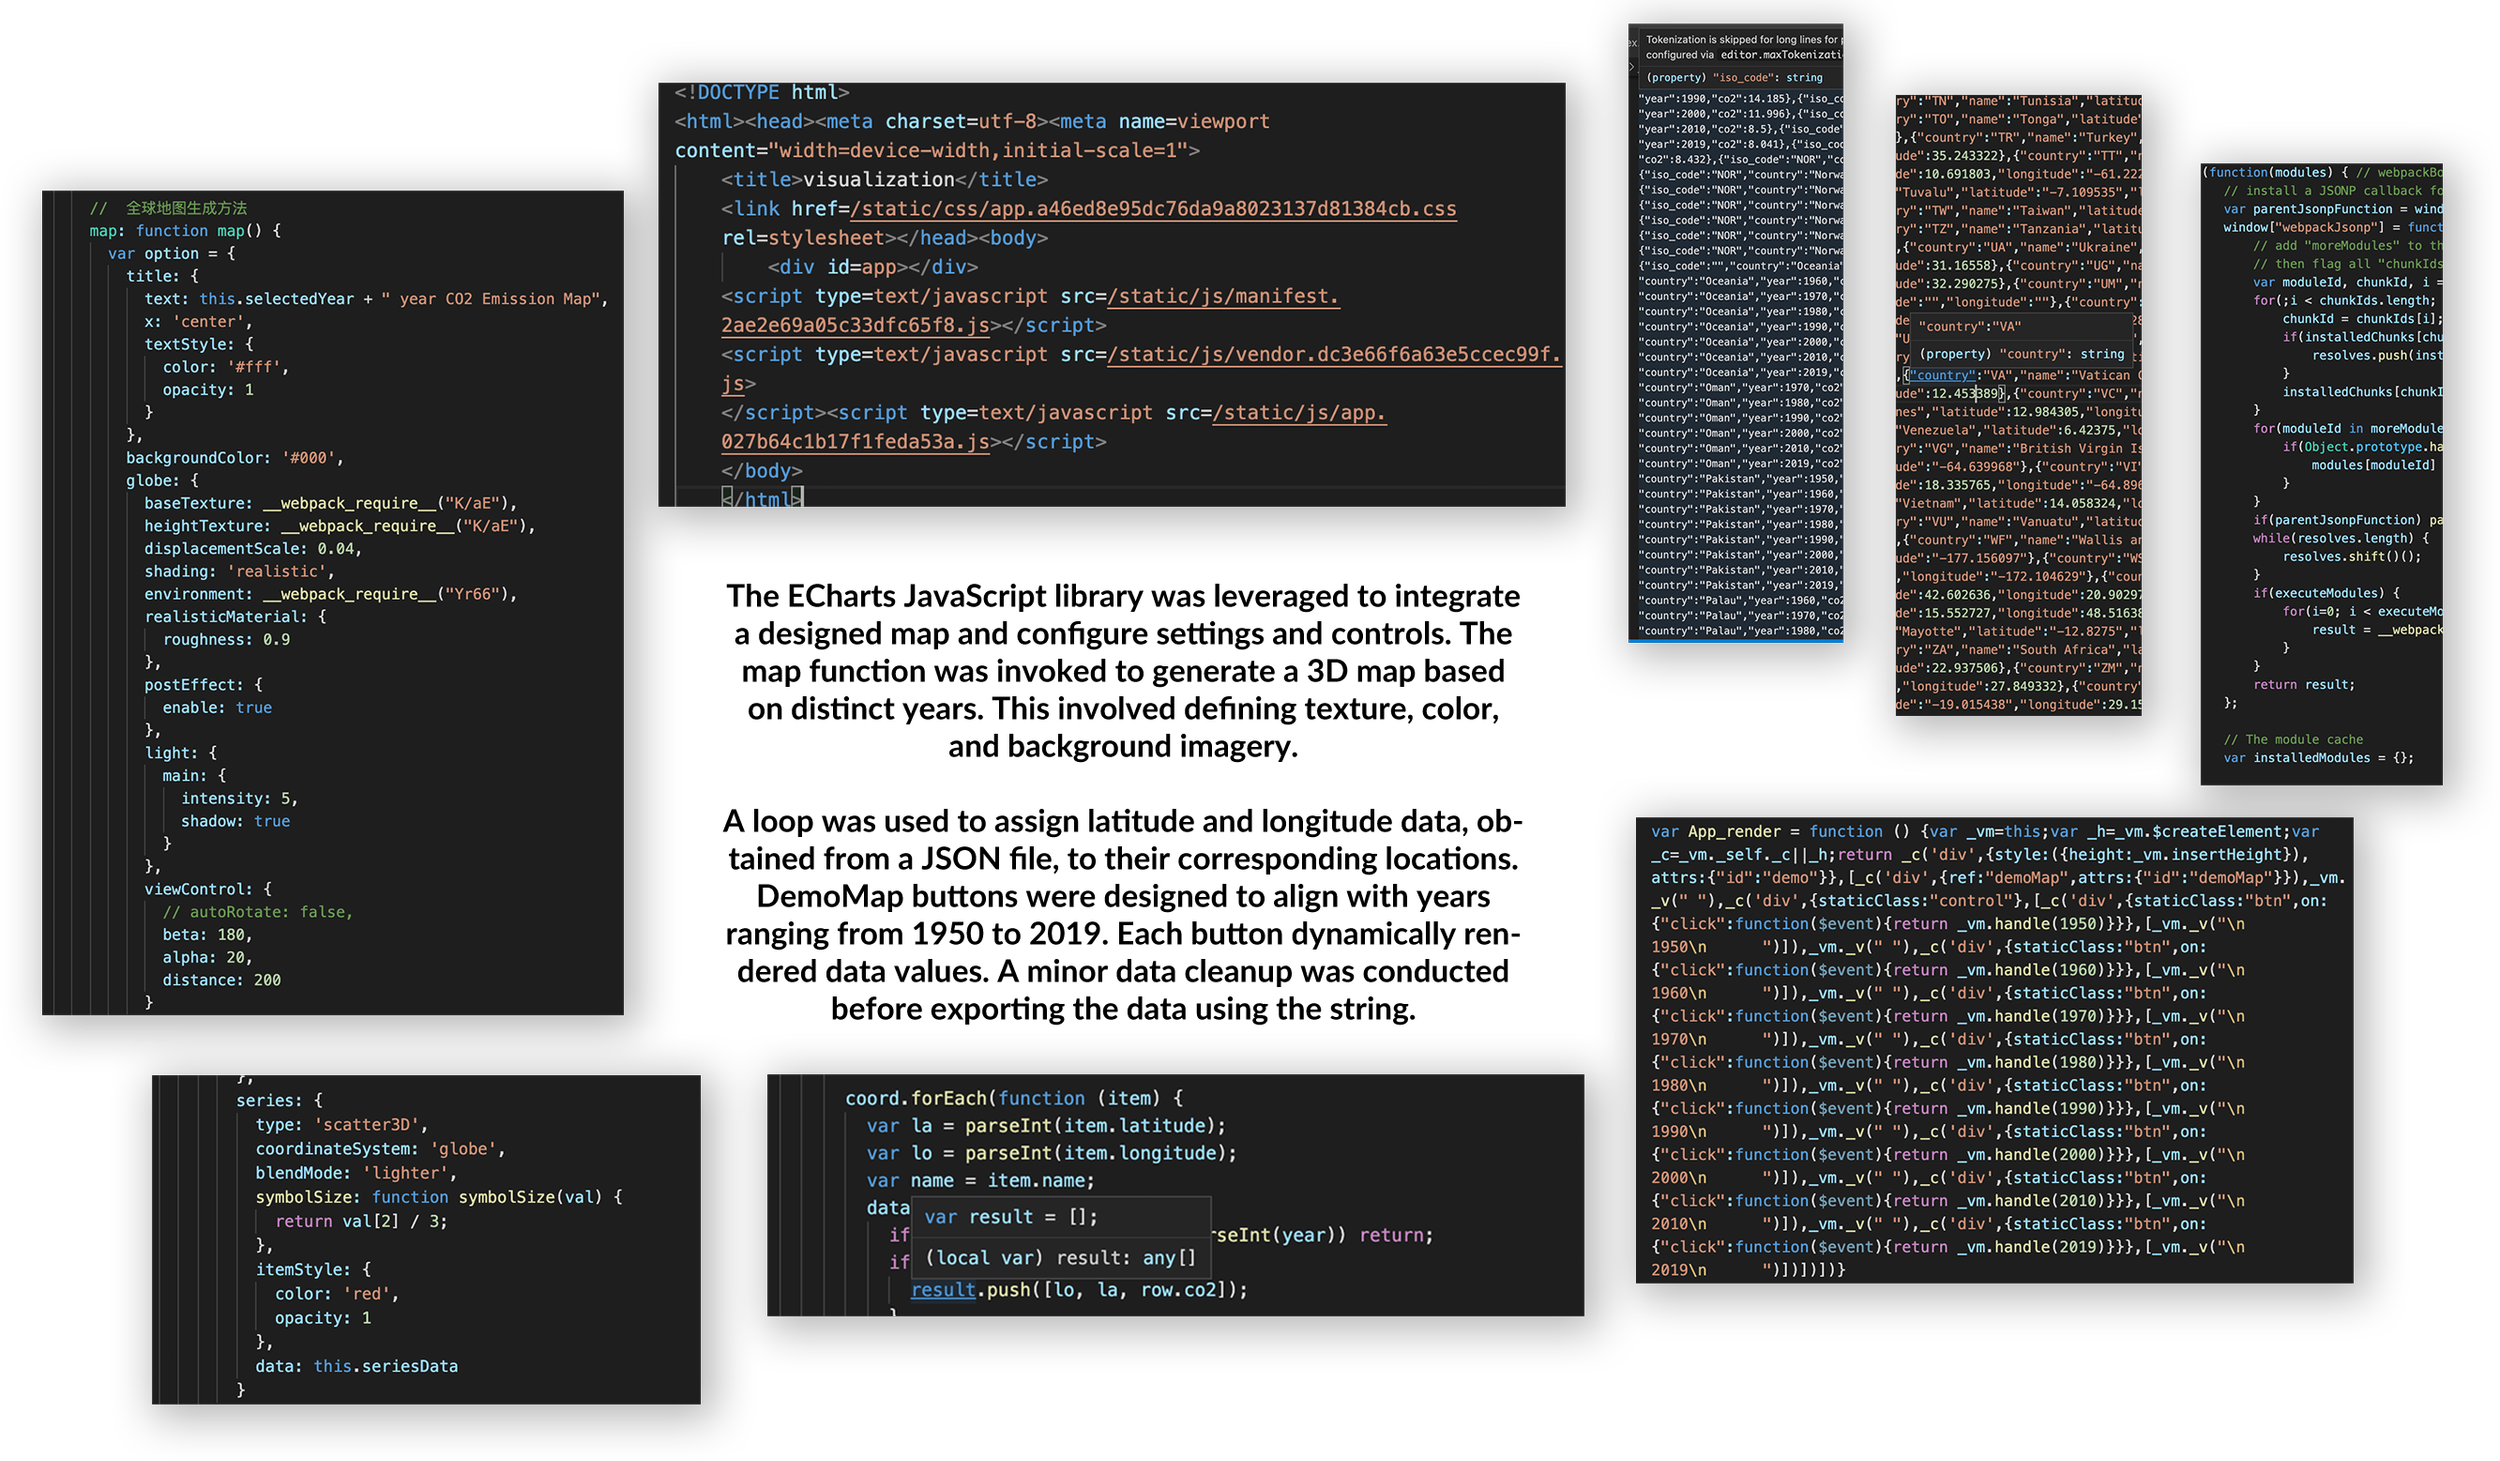
The Map
The Scatter Plot
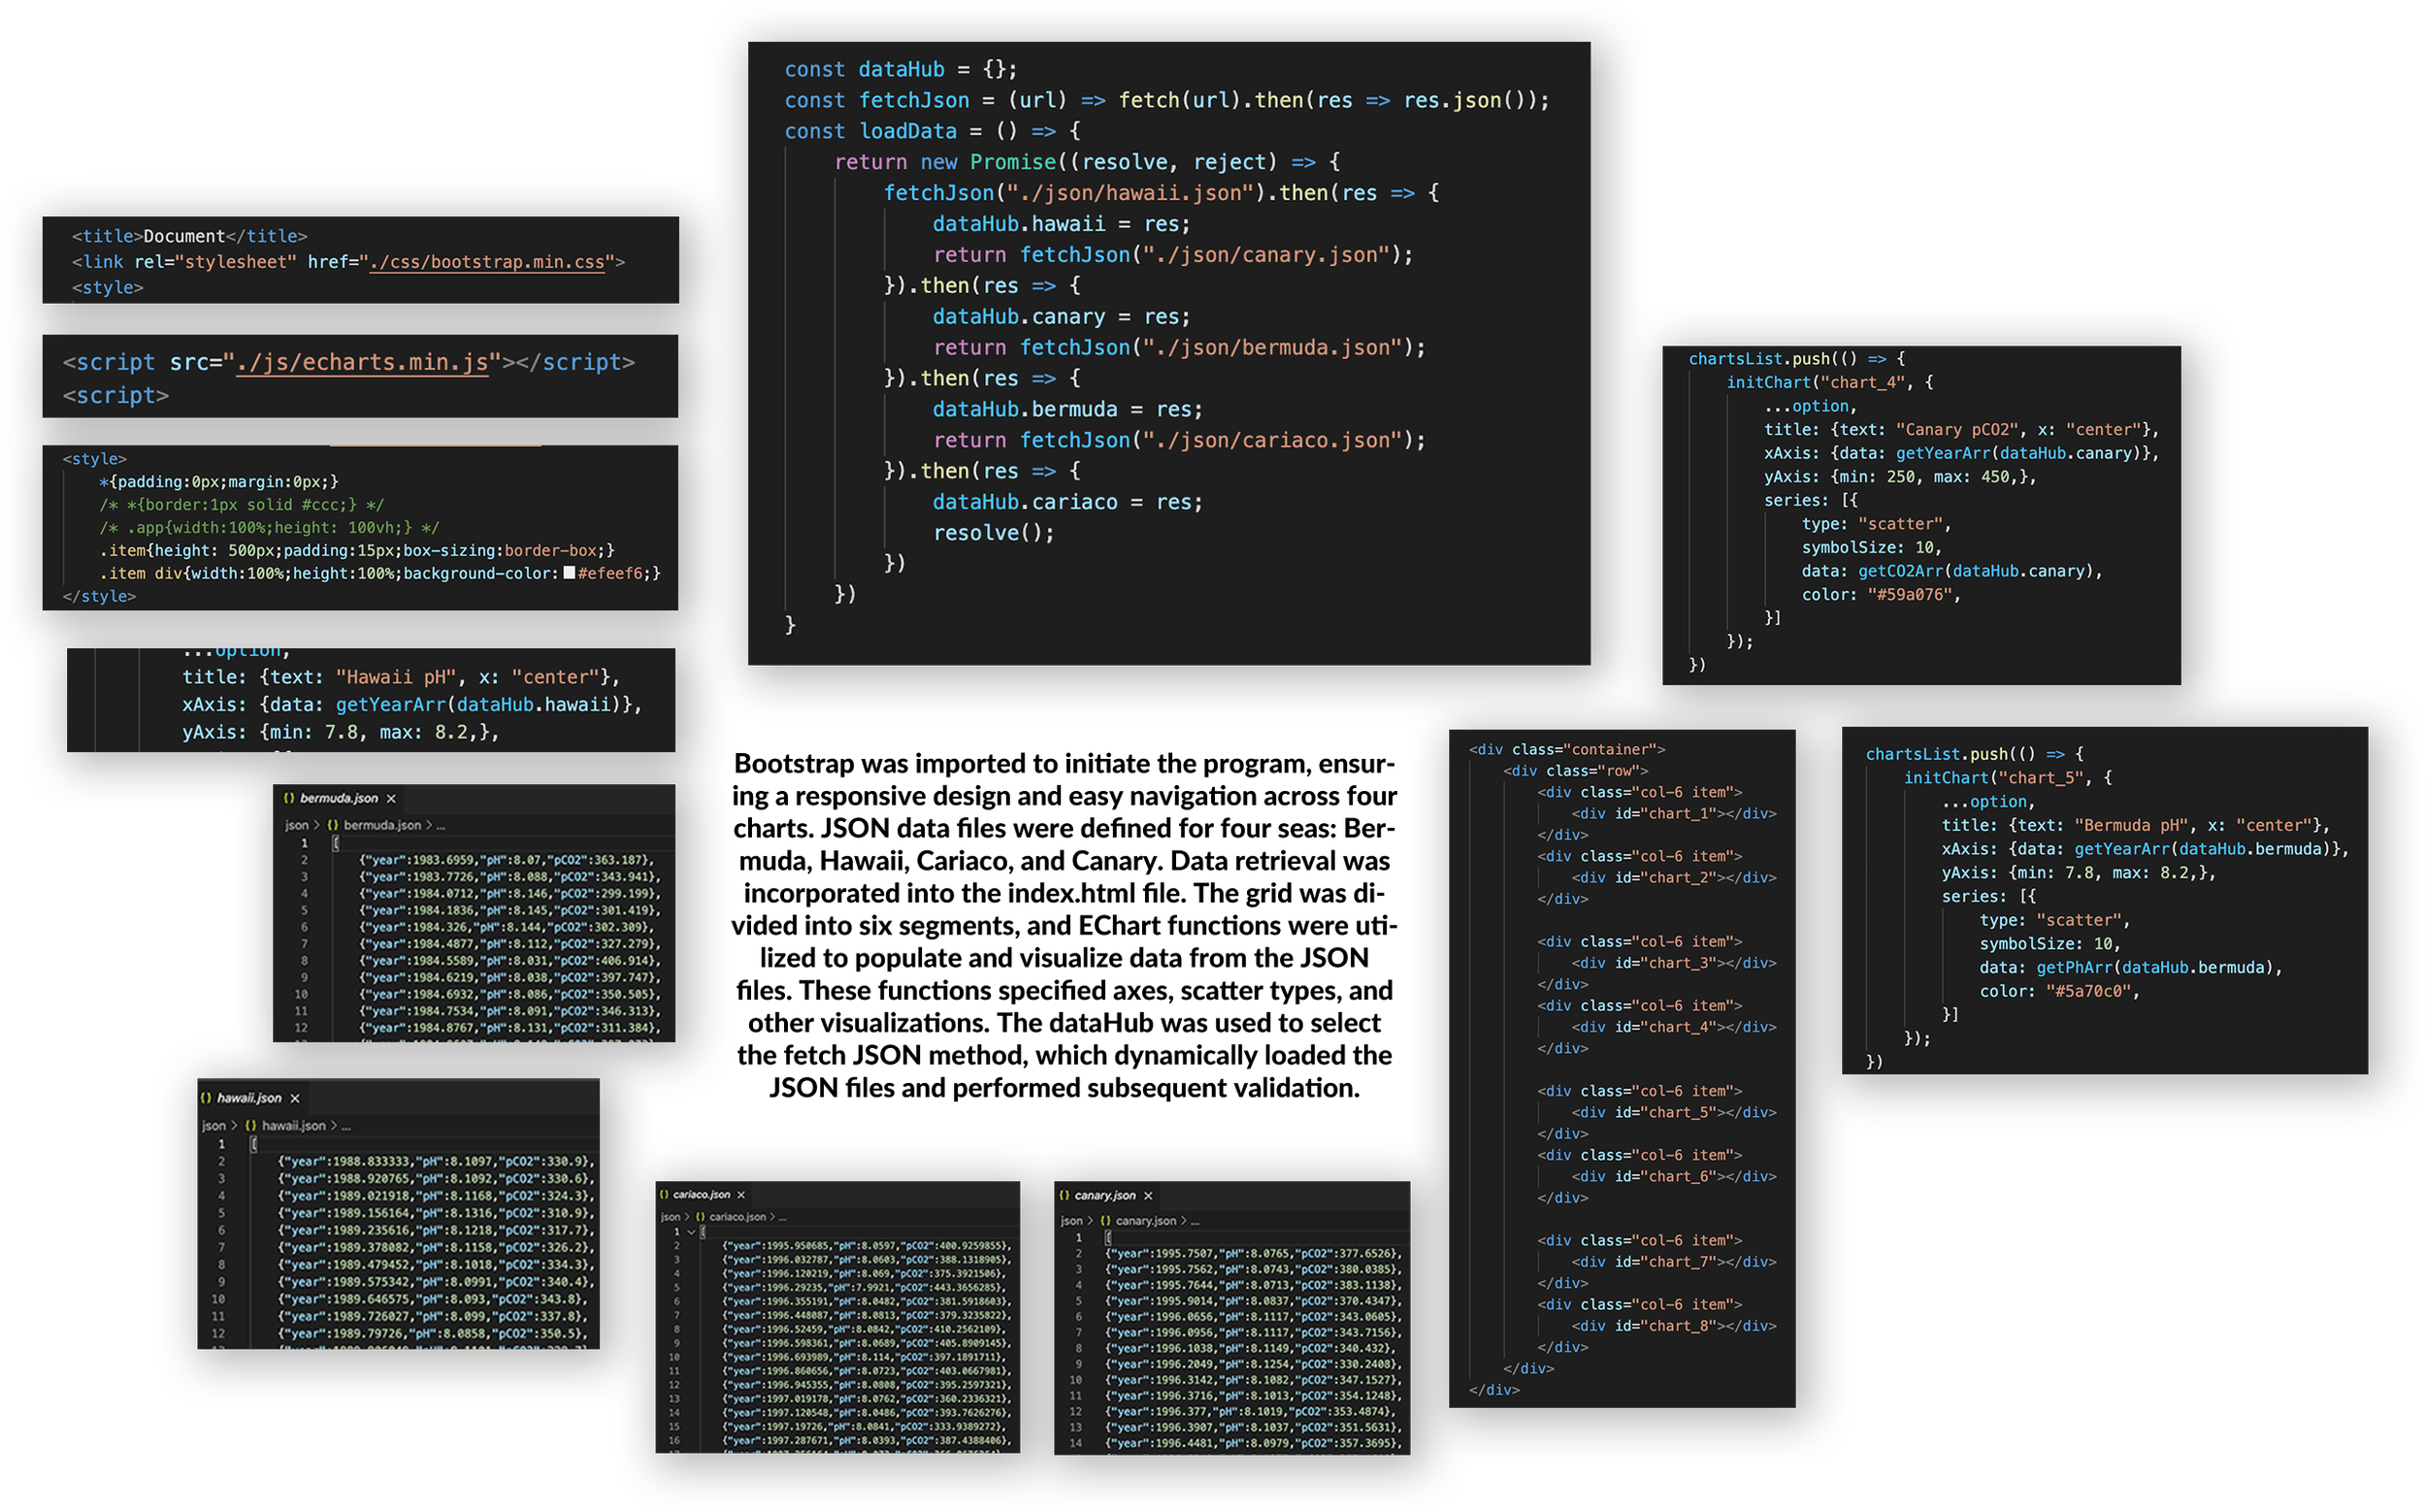
The Interactive Graphics
Finally, it’s time for showcase!!~
4. Design Prototype Showcase
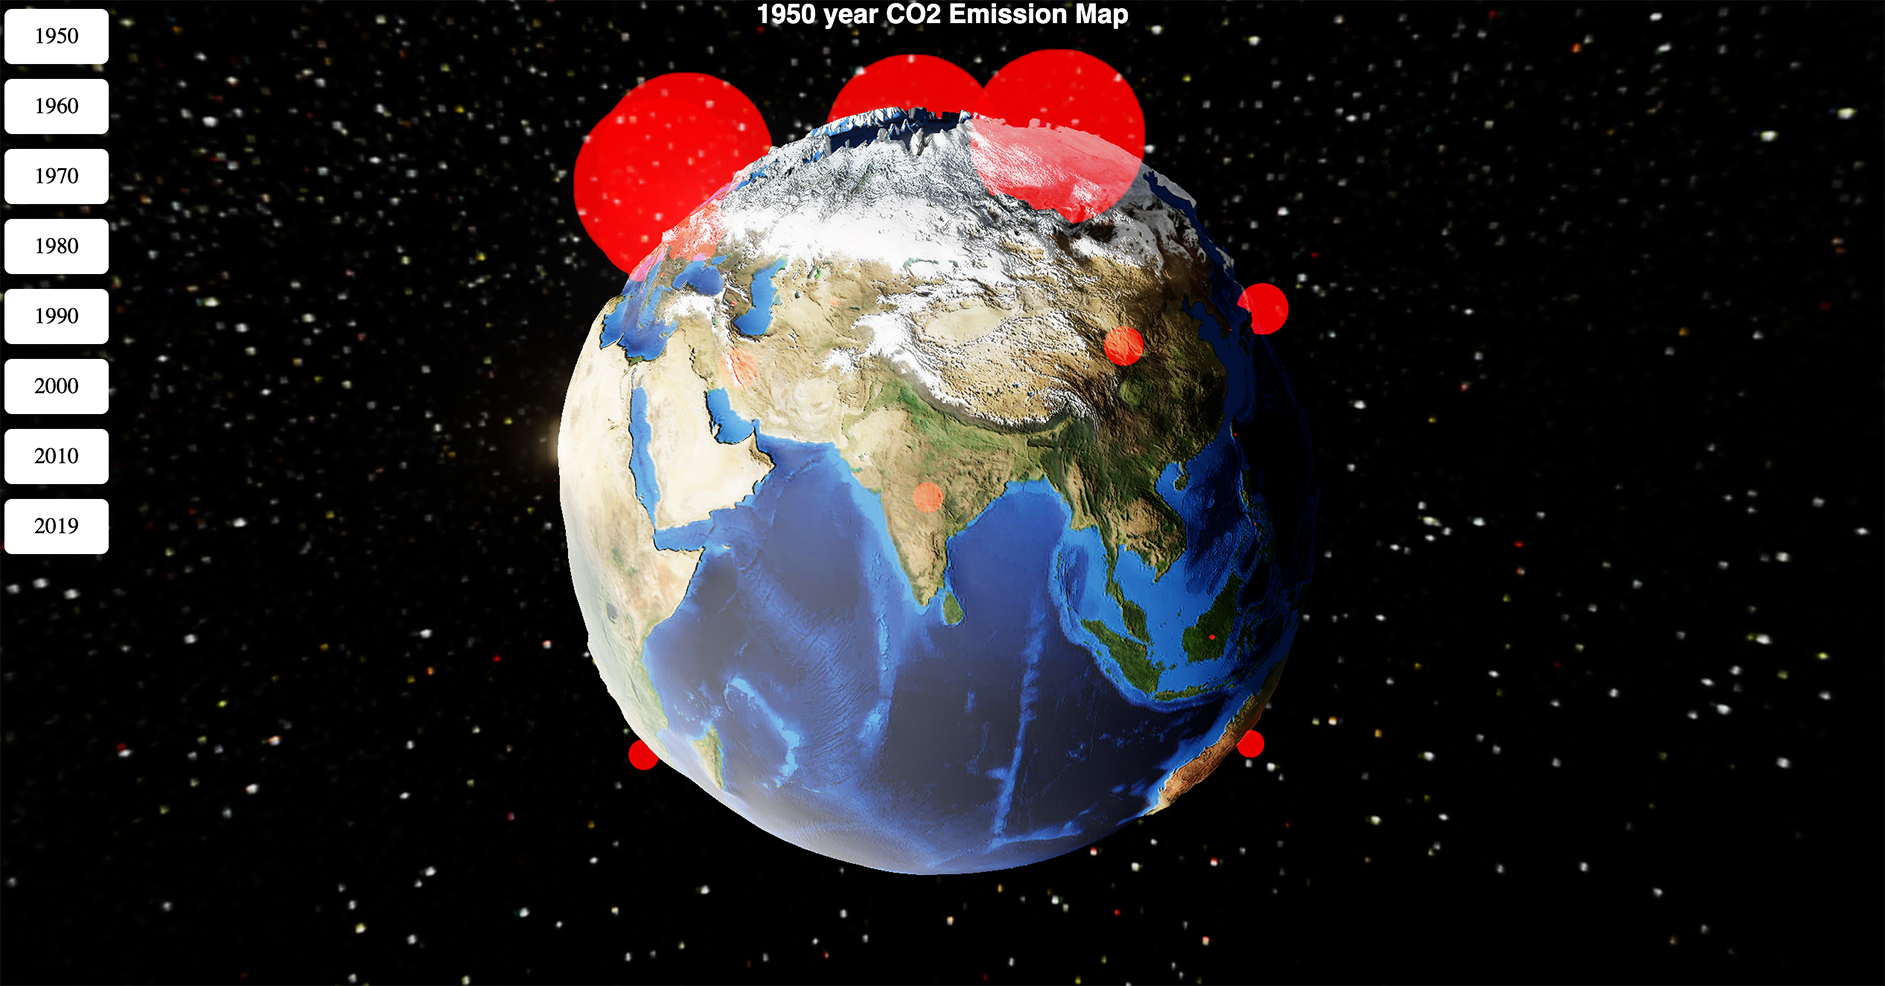
Part 1: The 3D Map
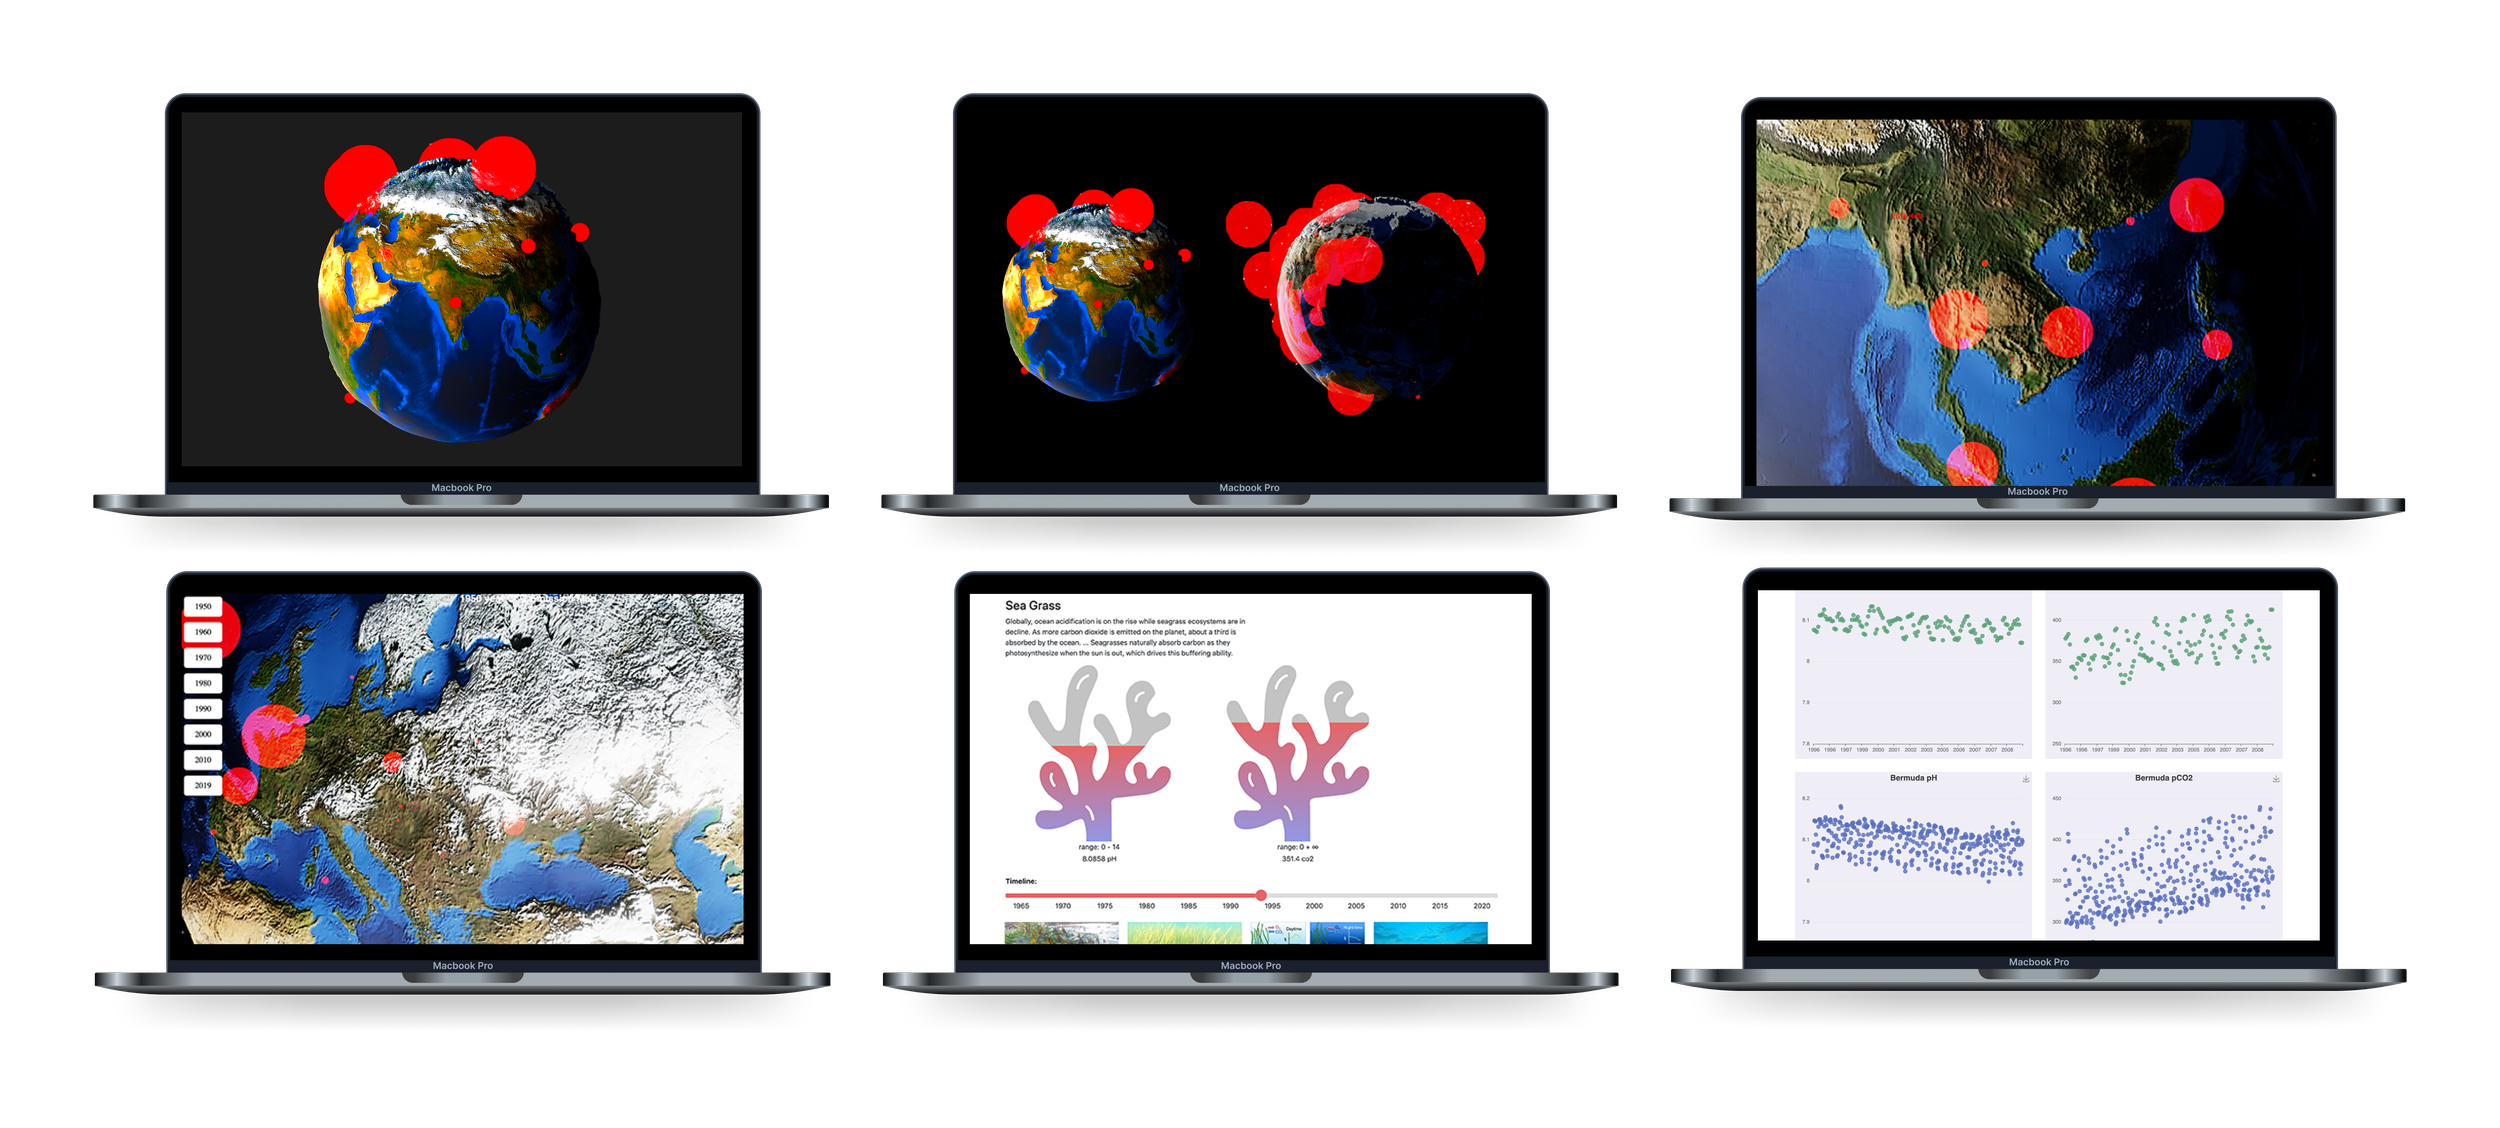
With mouse control to rotate the globle.
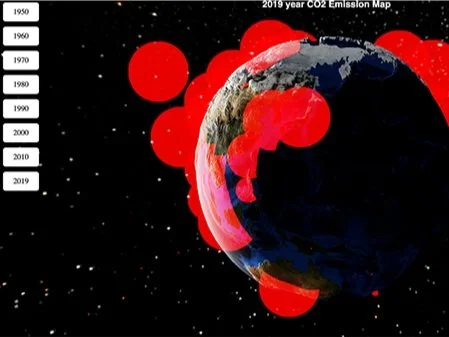
Users can select a year range for the map to display the ocean acidification data within the time range.
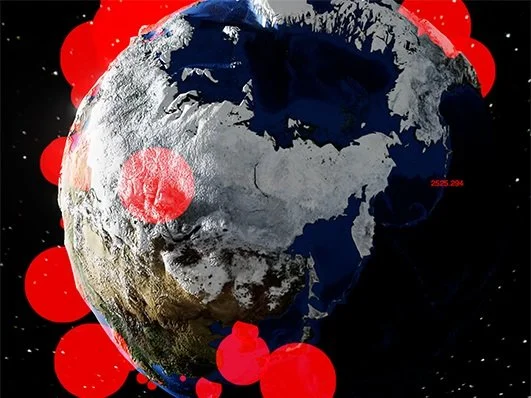
The dimension of the red circle represents the scale and density of the area where severe ocean acidification problem happens.
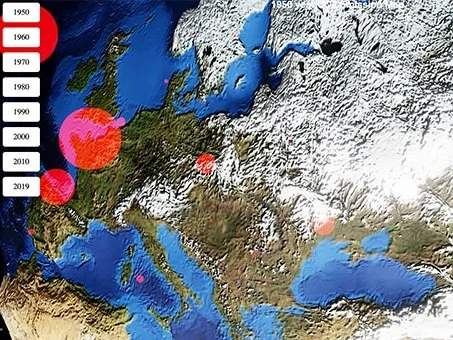
The map supports zoom-in effects with the adjustment through the scroll wheel on the mouse. In a more detailized view, the red circle separates to smaller circle that illustrates the location of contamination more accurately.
An accurate location coordinate will be displayed with a one-time click.
The Map Prototype
The Map Prototype

Part 2: The Scatterplots
Using data collected to perform scatterplots that display different pH and CO2 levels from different ocean regions over the year. Helps researchers to refer to the data and apply ocean conservation strategies.
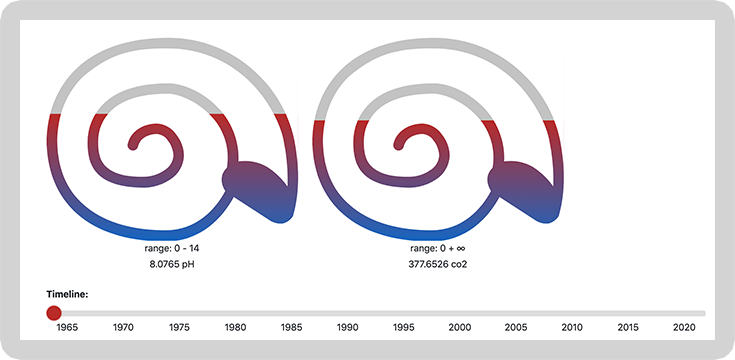
Part 3: The Dynamic Graphics
A grayscale bio-organism shape dynamically signifies its conditions; as ocean pH increases, the shape fades.
Informative imagery depicts the impact of ocean acidification on fish, enhancing viewer comprehension.
Timeline visualization allows chronological navigation, with fish color fading as time progresses.
Ocean Acidification is a severe problem effecting biological heath of our plannet!!
5. Summarizing & Reflecting
Up until now, this project has helped to reveal the yearly changing ocean HP levels for four regions of the sea: Bermuda, Hawaii, Carriacou, and the Canary Islands. From the visualization, it is evident that ocean acidification is a global phenomenon affecting various regions. Over time, the pH levels have generally decreased across all regions, indicating a rise in acidity. This trend is concerning as it can have detrimental effects on marine life and ecosystems.

This model of 3D maps, scatterplots, and dynamic graphics enables researchers and the public to view and compare the rate of acidification between different regions. The ocean acidification data visualization prioritizes conservation efforts and develops targeted strategies to mitigate the effects of ocean acidification.
Ocean Acidification Research References:
Definition:
- https://www.noaa.gov/education/resource-collections/ocean-coasts/ocean-acidification
- https://www.pmel.noaa.gov/co2/story/What+is+Ocean+Acidification%3F
- https://www.intelligentliving.co/ocean-acidification-more-harmful-than-previously-thought/
Data:
- https://www.epa.gov/climate-indicators/climate-change-indicators-ocean-acidity
- https://ourworldindata.org/co2-and-other-greenhouse-gas-emissions
- https://github.com/owid/co2-data
Infographic:
- https://ocean.si.edu/conservation/acidification/ocean-acidification-graph
- https://serc.carleton.edu/eslabs/carbon/7a.html
- https://www.epa.gov/climate-indicators/climate-change-indicators-ocean-acidity
- https://ysjournal.com/ocean-acidification-oa-how-it-affects-shellfish/
-https://www.mbari.org/science/seafloor-processes/emerging-science-of-a-high-co2low-ph-ocean/